| METADATA | |
| Data set name | High-Resolution Wind Resource Map for South Africa 2020 |
| Data set coverage | Land area of South Africa |
| Data set date | Compiled and published in March 2021 |
| Data set creator | DTU Wind Energy |
| Data set publisher | DTU Wind Energy and Council for Scientific and Industrial Research (CSIR) |
| Contact persons | Rogier Floors (DTU) or Ursula von Saint Ange (CSIR) |
| Contact details | rofl@dtu.dk (DTU) or UvstAnge@csir.co.za (CSIR) |
| Data type | Raster data sets with a grid cell size of 0.0025 degrees |
| Data format | Tagged Image Format files (TIF) and Arc/Info ASCII grid (ASC) |
| File name(s) | WASA3_<version ID>_<parameter>_<height AGL>.tif |
| Data origin | Microscale WAsP modelling in each grid point; no interpolation |
| Data storage | Wind Atlas for South Africa download site or DTU Data |
| DATA PARAMETERS | |
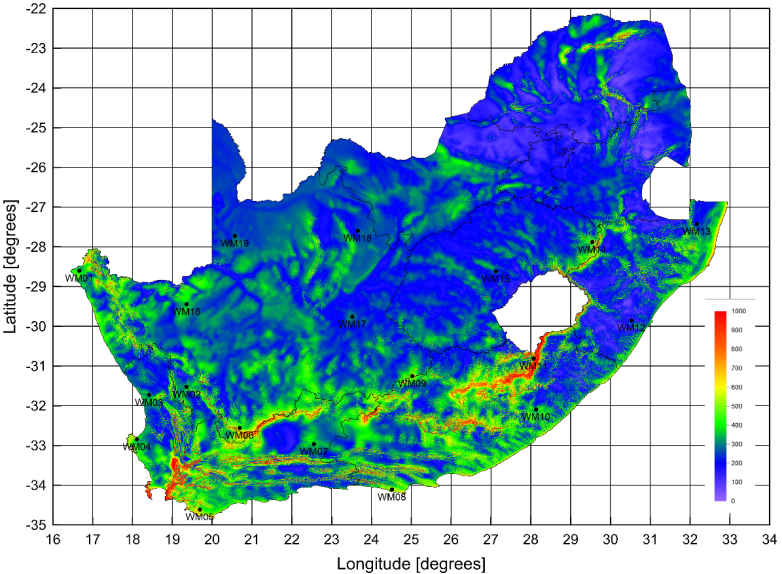
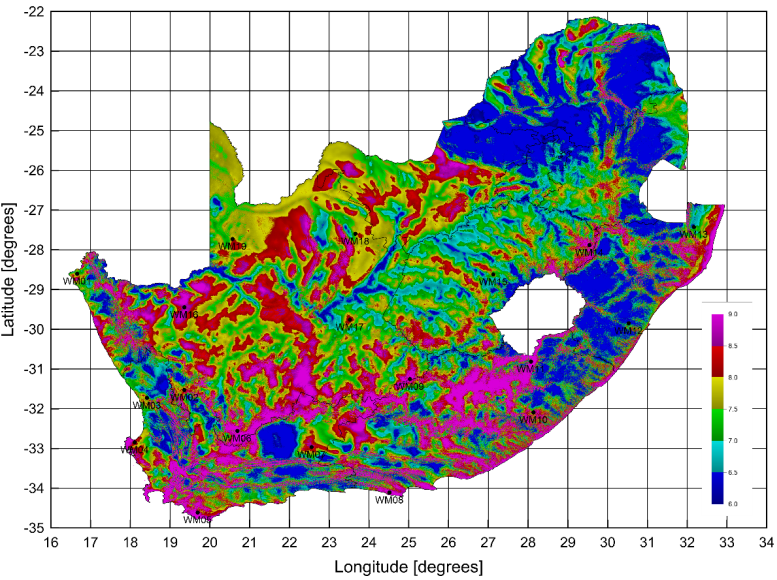
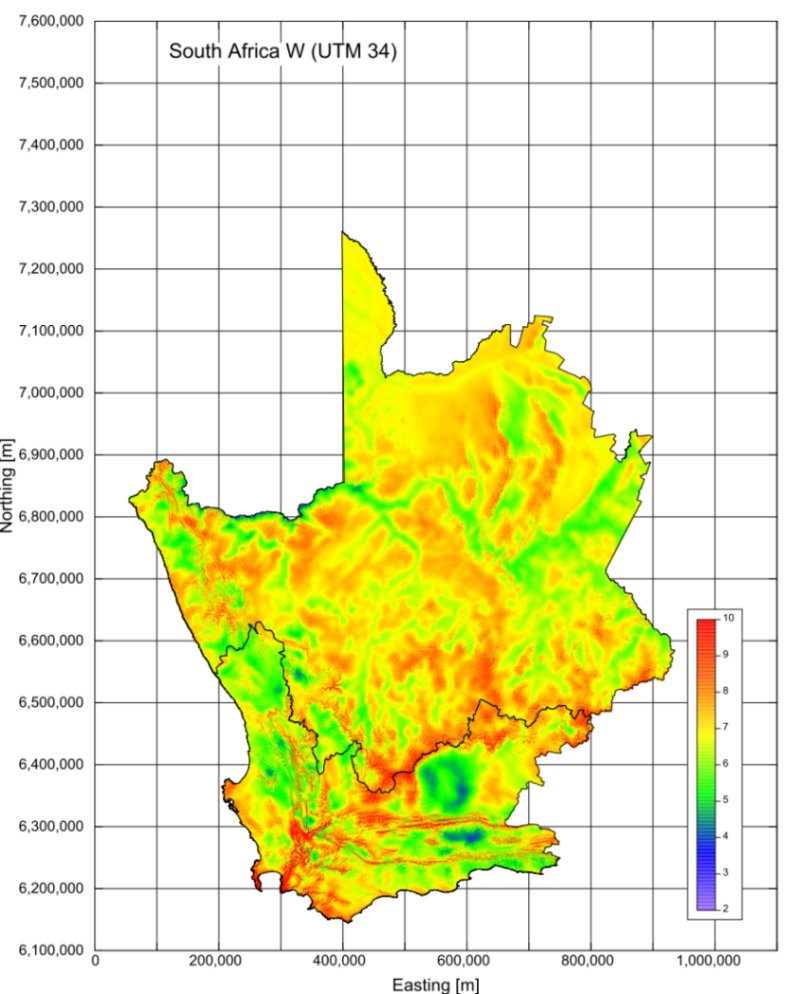
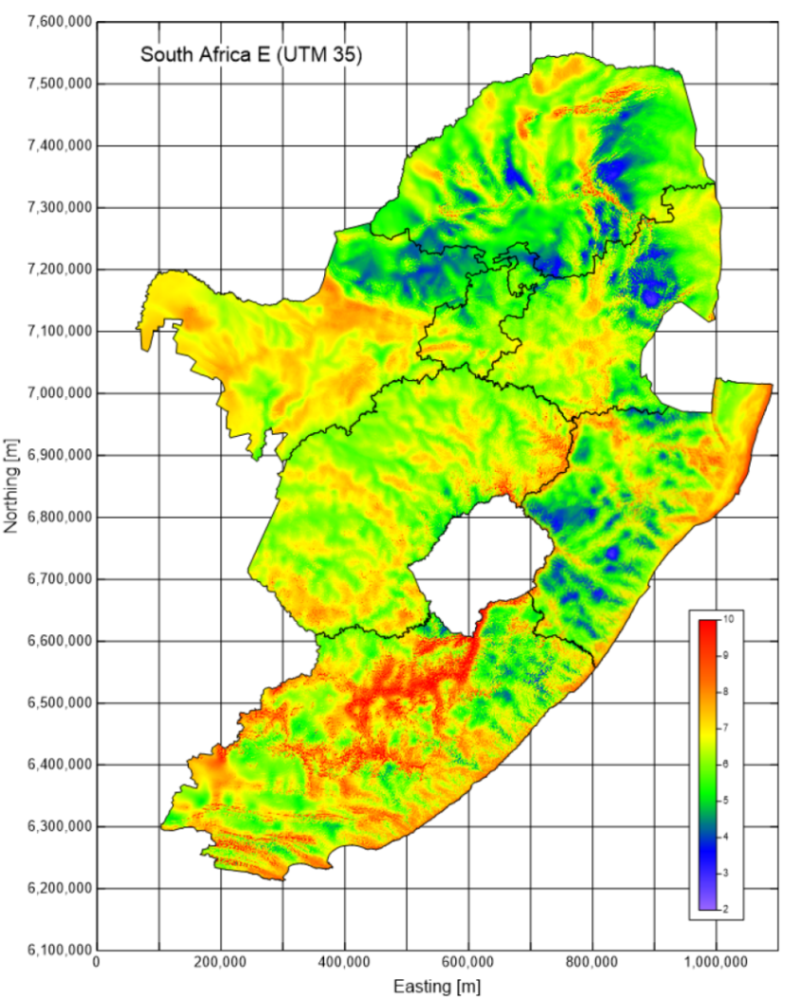
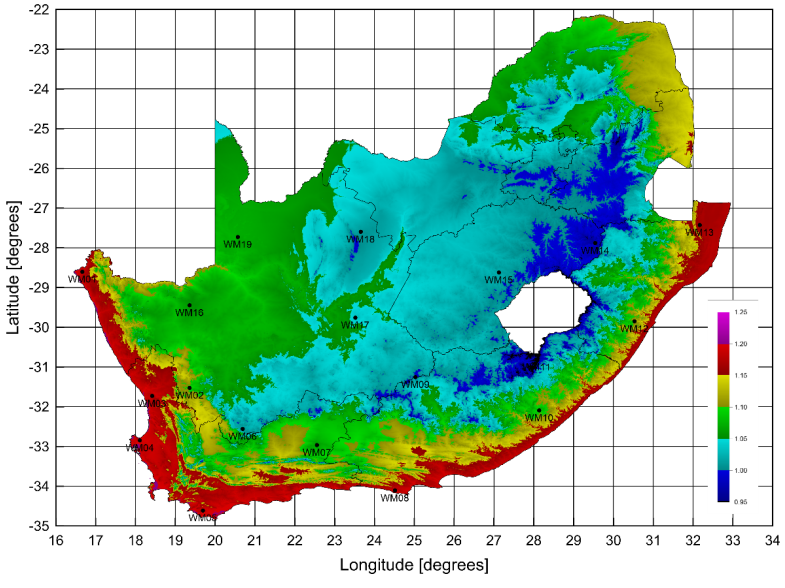
| Mean wind speed | Annual mean wind speed U [ms-1] @ 20, 50, 100 and 150 m a.g.l |
| Mean power density | Annual mean power density P [Wm-2] @ 20, 50, 100 and 150 m a.g.l |
| Mean air density | Annual mean air density ? [kgm-3] @ 20, 50, 100 and 150 m a.g.l |
| Weibull A parameter | Weibull scale parameter A [ms-1] @ 20, 50, 100 and 150 m a.g.l |
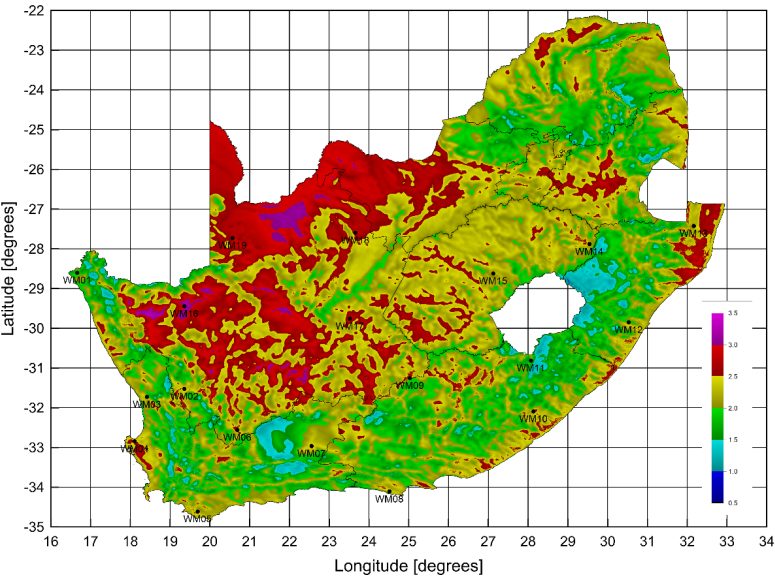
| Weibull k parameter | Weibull shape parameter k [n/a] @ 20, 50, 100 and 150 m a.g.l |
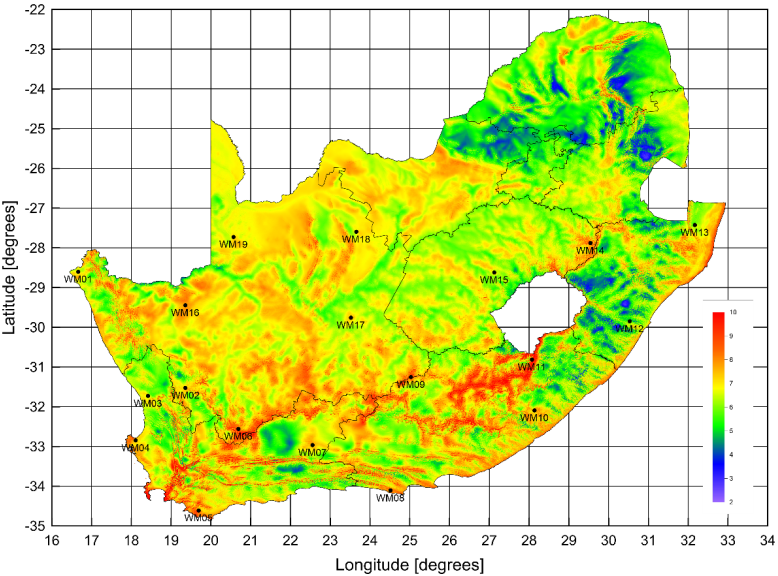
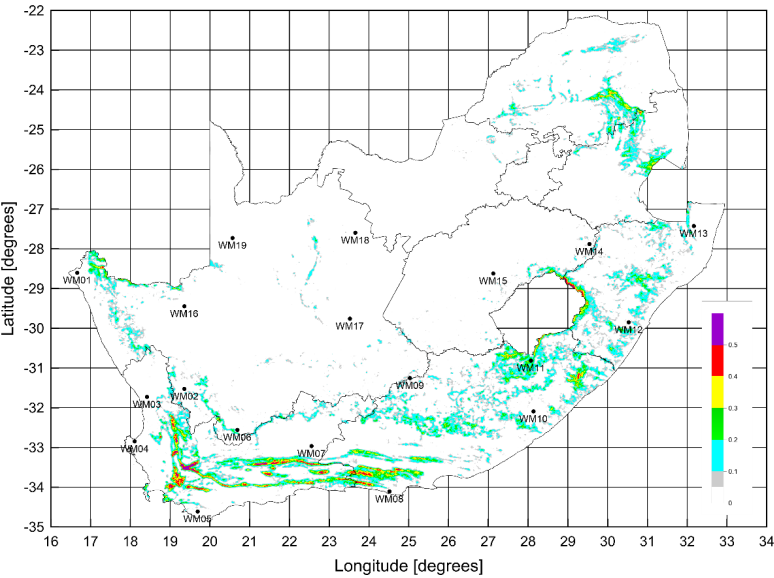
| Ruggedness index RIX | Site RIX value [n/a] calculated by WAsP (standard parameters) |
| COORDINATE SYSTEM |
|
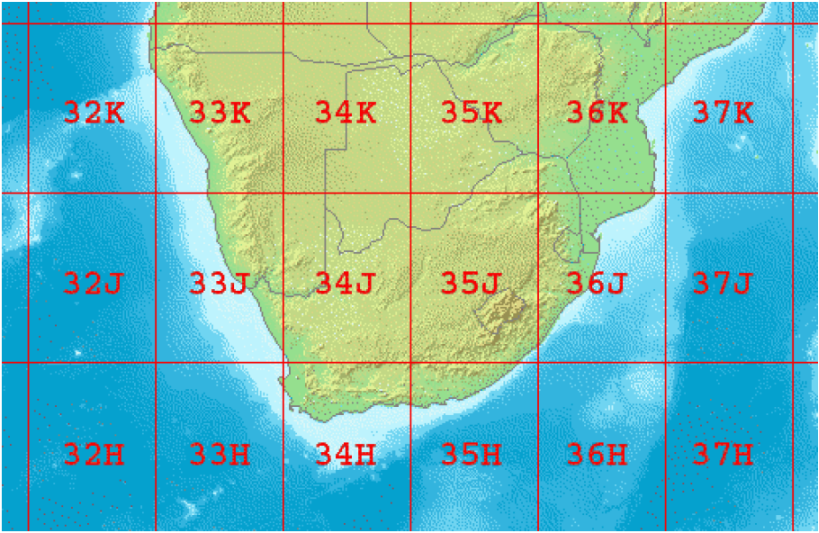
| Projection | Geographic latitude and longitude (lat/lon) |
| Datum | World Geodetic System 1984 (WGS 84) |
| TECHNOLOGY | |
| Modelling software | WAsP Resource Mapping: PyWAsP Swarm 0.1.0, PyWAsP 0.4.1 |
| Wind-climatological input | 3.3-km NWA, WRF 3.8.1, ERA5 boundary conditions, 1990-2019 |
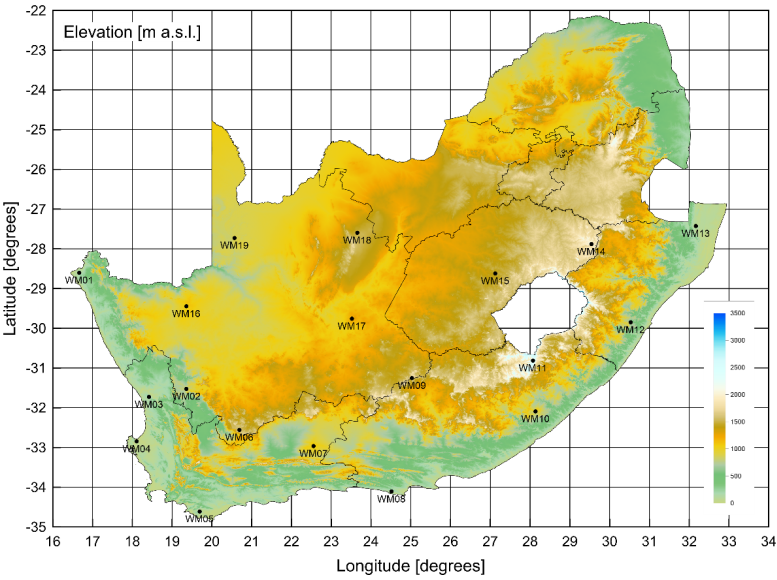
| Elevation data input | 100-m elevation grid derived from SRTM+ (NASA version 3) |
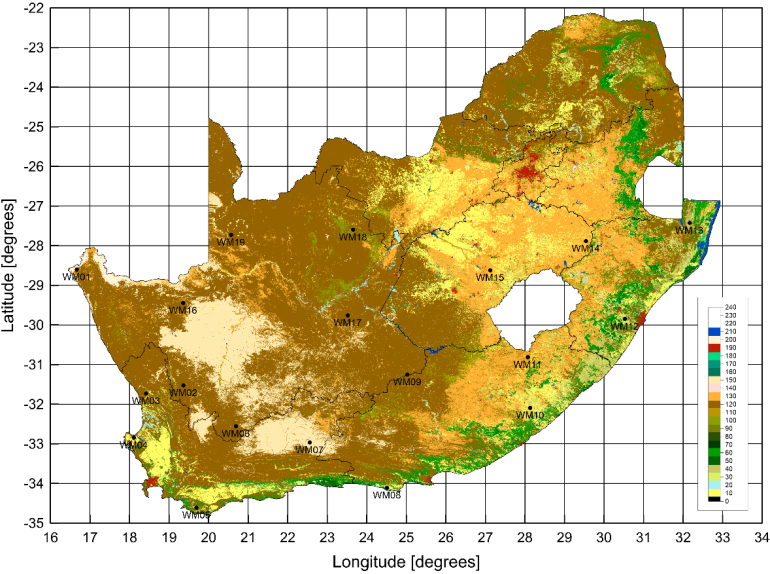
| Land cover input | 300-m land cover grid, ESACCI 2015 (version 2.0.7) w/ DTU table |
| Air density input | 0.25-degree ERA5 global reanalysis data 2010-2019 |
| DESCRIPTION |
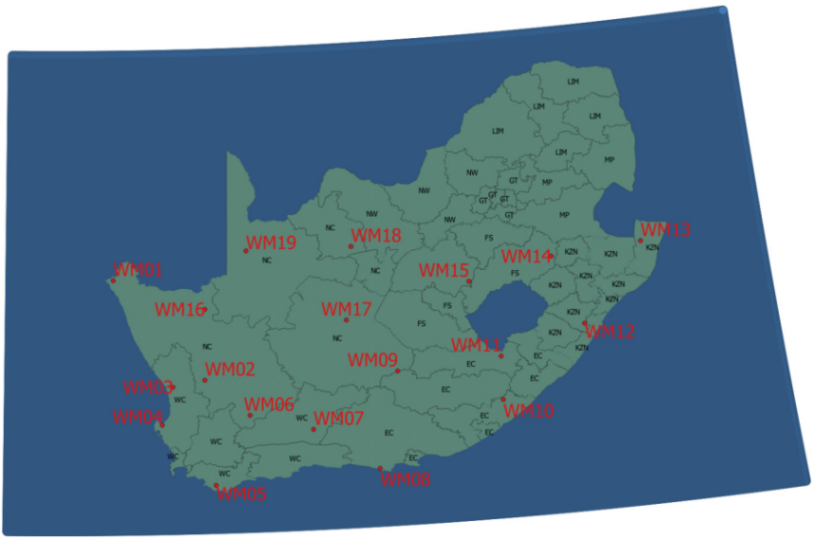
| Purpose These data sets were created as part of the Wind Atlas for South Africa project (WASA). The wind resource maps were originally designed for inclusion in GIS-based strategic environmental assessments (SEA) for the entire land mass of South Africa. The maps cover 9 provinces of South Africa, corresponding to an area of about 1,221,000 km2. The wind resource maps are based on high-quality wind data and contemporary models; but the maps are subject to change without notice if and when more accurate and reliable data, models and procedures become available Methodology Reference is made to the information and documentation available from www.wasa.csir.co.za. Much more detailed descriptions of the data sets and model validation are reported on this web site and elsewhere. Limitations The data set is limited by the operational envelopes of the wind atlas methodology and the WAsP models. The accuracy depends on a) the accuracy of the VNWA, which has been validated against the data from 19 WASA measurement masts, b) the WAsP 12 microscale modelling and c) the input topographical data. In complex terrain (RIX > 5%), the wind resources may be significantly over-estimated by the WAsP IBZ microscale model. Above and close to built-up areas like cities, towns and villages, the results are less reliable. Close to and above forested areas, the results are also less reliable and should be interpreted and used accordingly. The data set was designed specifically for planning purposes and should be used with utmost care for design, development and detailed assessments of actual wind farms; where local, on-site measurements are strongly recommended. Such measurement campaigns may be designed using this data set and the VNWA. Available documentation The wind atlas methodology is described in the European Wind Atlas (1989); the application of WAsP in the software documentation, see www.wasp.dk. The Validated Numerical Wind Atlas (VNWA) for South Africa is a product of the Wind Atlas for South Africa project (WASA) and is described on the WASA download pages. Air density calculation and data: Floors, R., & Nielsen, M. (2019). Estimating Air Density Using Observations and Re-Analysis Outputs for Wind Energy Purposes. Energies 12(11), 2038. doi.org/10.3390/en12112038. Acknowledgements WASA team for provision of wind-climatological and topographical data. WAsP development teams at DTU Wind Energy and at World in a Box Oy for WAsP Resource Mapping System (PyWAsP Swarm) development and application. SRTM Plus data were downloaded from NASA's Land Processes Distributed Active Archive Center (LP DAAC) located at the USGS Earth Resources Observation and Science (EROS) Center. ESACCI 2015 land cover data are copyright ? ESA Climate Change Initiative, Land Cover project 2017. South African province boundaries by Municipal Demarcation Board (MDB). |
| DISCLAIMER |
| In no event will the Technical University
of Denmark (DTU) or any person acting on behalf of DTU be liable for any damage,
including any lost profits, lost savings, or other incidental or consequential
damages arising out of the use or inability to use the information and data
provided in this data set, even if DTU has been advised of the possibility
of such damage, or for any claim by any other party. The principles, rules, exclusions and limitations provided in the Disclaimer on the WASA download site apply to the data set described here as well, even though this data set may not be distributed via the web site. By using this data set, you agree that the exclusions and limitations of liability set out in this disclaimer are reasonable. If you do not think they are reasonable, you must not use this data set. |