
Other links: WASA Online Graphs WASA FAQ Wind Atlas for South Africa (WASA).kmz
WASA1: Arrangement Drawing Instrumentation Summary Mast Site Information Station and Site Description Report (April 2014).pdf
WASA2: Arrangement Drawing Instrumentation Summary Mast Site Information Station and Site Description Report (April 2017).pdf
WASA3: Arrangement Drawing Instrumentation Summary Mast Site Information Station and Site Description Report (Dec2019) v1.pdf
The WASA download site
This is the download site for the Numerical atlas
for South Africa
To provide feedback to the WASA team, you can optionally download
and fill in the questionnaire, and e-mail to the Webmaster
Numerical Wind Atlas
The WASA numerical wind atlas contains generalized wind atlas data sets for tens of
thousands of model grid points covering all of South Africa. The WASA programme has
three phases. WASA1 for the domain of WC and areas of NC and EC was completed in 2014.
WASA2 focus is KZN, EC and FS, while WASA3 is modelling all of South Africa. WASA2 and
WASA3 are ongoing with completion in 2018 and 2020 respectively. WASA1 measurements
have been continued through all phases since 2010. WASA2 measurements were added since
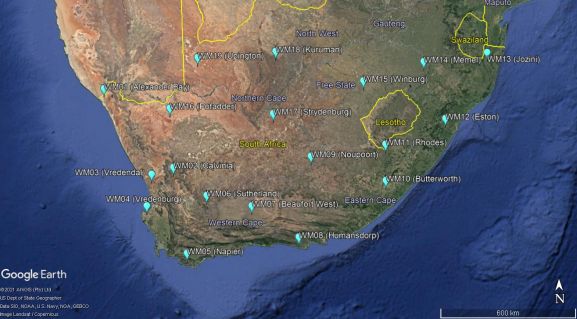
2015 and WASA3 measurements will be on line from mid-2018. The location of the 10 WASA1
met. stations as well as the 5 WASA2 met. stations are shown here:
The wind atlas data sets for each grid point are stored in a database; the grid point locations
can be viewed in Google Earth:
Download
Data access and system requirements (WASA 2)
The complete set of wind atlas data sets consists of 3-km LIB
files for the WASA 1 domain, 5-km LIB files and 3.3-km LIB files
(Dec 2018) for the entire South Africa. The LIB files are stored
in ZIP archives and the names and positions are given in three
different format files: CSV (MS Excel), DAT (simple ASCII text)
and KMZ (Google Earth).
Please choose the file(s) you wish to download.
Background
Introduction
The Numerical Wind Atlas method has been developed to obtain good
indications of the wind climate and geographical distribution of the
regional wind resource in large domains with scarcity of high quality
wind measurements. This is particularly aimed at needs in public
planning and useful for decision making and planning of feasibility
studies and of actual project preparation.
The methodology used for the wind atlas for WASA is applying downscaling
from global datasets to local terrain surface winds. The basis for the
method is that there is a robust relationship between meteorological
situations at the large-scale and the wind resource at a given location.
Information about the large-scale meteorological situation is freely
available from several different reanalysis data-sets. These data-sets
have been created by assimilating measurement data from around the globe
in a consistent fashion for several years as e.g. from the NCEP/NCAR
data-set that has reanalyzed data from 1948 to the present day. Our
application of such data-sets is as a long term record of large-scale
wind conditions.
Modelling
Under revision � updated version available by 1st of July 2018
Return to top
WASA Observational Wind Atlas
The WASA observational wind atlas contains observed (OWC) and generalised (GWC) wind atlas data
sets for the 15 meteorological stations established and operated by the WASA project.
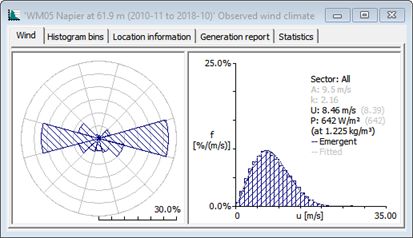
Observed wind climates (OWC)
|
Observed wind climate files from the 15 WASA stations. The data mostly cover an eight
year period from November 2010 to September 2018 for the WASA
1 masts and a three-year period from November 2015 to October 2018 for the WASA
2 masts.
The observed wind climate consists of the wind direction distribution
(wind rose) and the sector-wise and total wind speed distributions.
Download
|
|
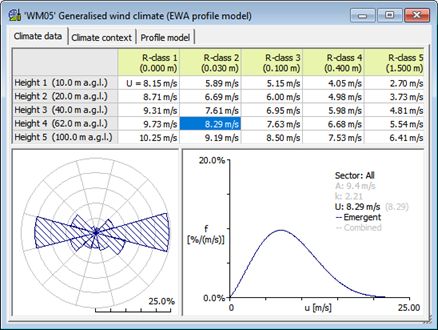
Generalised wind climates (GWC)
|
Generalised wind climate files from the 15 WASA stations. The wind atlas data sets mostly represent an eight-year period from November 2010 to October 2018 for the WASA 1 masts and a three-year period from November 2015 to October 2018 for the WASA 2 masts.
The generalised wind climate consists of wind roses and sector-wise wind
speed distributions over flat uniform terrain, for five standard heights and
five standard roughness classes.
The standard heights are adapted to the WASA met. station measurement
heights: 10, 20, 40 and 62 m above ground level.
Download
| 
|
WAsP analysis of the WASA stations
The WAsP workspace WASA 1+2 validation 2018.wwh contains data and sample maps for the 15 meteorological stations in the Wind Atlas for South Africa. The file was established by the WASA project for the Observational Wind Atlas for South Africa.
The wind atlas data were calculated using the available information at the time of writing and the
results may change in subsequent analyses and editions.
The following files are not yet available on the local server, but can be downloaded from the DTU server
- Observed wind climate (OWC)
- Generalised wind
climates (GWC)
- WAsP analysis of WASA
stations (WWH)
Return to top
Case Studies
The case studies are provided to illustrate
how observational and numerical wind atlas data can be used for wind resource
assessment and siting � for wind resource mapping and wind farm calculations. The case studies can be opened using WAsP 12.2, but may use different types and versions of wind and topographical input data to illustrate the calculations.
Observational wind atlas
Wind atlas data sets are based on observed wind climates from the
meteorological station(s); the data cover periods of whole years from 2010 to
the present day.
Elevation maps were derived from SRTM 3 elevation grids, re-gridded in the UTM coordinate system. The grid cell size is here 50 m and the contour interval 10 or 20 meters. Simple land-sea maps with coastline, rivers and lakes were derived from the SWBD data set; roughness length initially 0.03 to 0.07 m for land and 0 m for water bodies. More complete land cover maps exist now for the mast sites; based on GlobCover 2009 or on the ESA CCI 2015 data sets.
Numerical wind atlas
Wind atlas data sets are based on KAMM- or WRF-derived LIB files. In WASA Phase 2, only WRF data are available. These data sets are stored in NC archives and overviews of the locations are given in KMZ files for use with Google Earth. Once you have identified the LIB file names, the wind atlas data can be selected from the archive. These data are long-term data and may not compare directly to observation-based atlas data described above.
Please choose the file(s) you wish to download.
Return to top
The project brief listed below provides a brief overview of the Wind Atlas for
South Africa project.
The reports listed below contain a summary of work done in the Wind Atlas for
South Africa project so far and further contains guidelines for measurements and
microscale modelling in South Africa.
The guideline provided is mostly relevant for users of the WAsP software, but
contains also general guidelines and instructions for making elevation and
roughness length maps.
The following files are not yet available on the local server, and the link to the DTU server will follow
- WASA Brief 09 Mar2012.pdf
- WASA1 Station and Site Description Report (April 2014).pdf
- WASA2 Station and Site Description Report (April 2017).pdf
- WASA1 Observational Wind Atlas Report (December 2018).pdf
- WASA2 Observational Wind Atlas Report (December 2018)(DRAFT).pdf
- Wind resource assessment using the WAsP software (DTU Wind Energy E-0174, December 2018)]
- Guide to accessing and viewing the Wind Atlas for South Africa.pdf
- Beginners Guide to Microscale Modelling using WAsP_v5.pdf
Useful links
SANERI�s Wind Atlas for South Africa site,
www.wasaproject.info, contains general information about the Wind Atlas for
South Africa project (WASA).
The WASA data are displayed at the CSIR Online site,
www.wasa.csir.co.za.
The Weather Research and Forecasting (WRF) model data can be downloaded from the
WASA forecast site,
veaonline.risoe.dk/wasa/
The magnetic declination at a site can be estimated using the
magnetic declination
calculator provided by NOAA's National Centers for Environmental Information (NCEI).
The Municipal Demarcation Board web site,
www.demarcation.org.za,
contains data defining the borders of South African provinces, districts and
municipalities. Download in several different formats is free of charge.
Return to top
In order to do flow modelling for any site in South Africa, one needs
descriptions of the topography of the site: elevation variations, land
cover and nearby sheltering obstacles. This section describes some sample
data sets that can be used for this purpose.
High-resolution gridded (or raster) elevation data exist for many parts of the world,
one such data set is the Shuttle Radar Topography Mission (SRTM) data set. The current
version of WAsP cannot employ such data raster directly, so it is necessary to make a height
contour (vector) map from the raster data.
The WAsP Map Editor can download SRTM data and
construct the elevation vector map directly (File > Import > From Web-Database). Other freely available software programs that
can be used to make WAsP vector maps from SRTM data are described in an appendix to
Wind resource assessment using the WAsP software (DTU Wind Energy E-0174).
SRTM files can also be downloaded through the USGS Global Data Explorer.
Coastlines, lakes and rivers � SRTM Water Body Data (SWBD)
The SRTM Water Body Data (SWBD) set contains coastlines, lakes, and rivers in SHP
format. SAGA GIS can read such files, but so can the WAsP Map Editor. The elevation
map constructed by the WAsP Map Editor as described above will also contain
coastlines, lakes, rivers, etc. (File > Import > From Web-Database).
Land cover and roughness length
The land cover (roughness length) map can be digitized from a scanned paper map,
aerial photo-graph or satellite imagery as described in the WAsP Map Editor
help file. However, one can also digitise the roughness change lines directly
in Google Earth using the �Add > Path� and �Add > Polygon� commands:
The resulting kml / kmz file can be imported directly into the WAsP Map
Editor (File > Import), where the roughness length values can then be assigned
The latest version of the WAsP Map Editor can import and translate some raster-based
land cover data sets. (File > Import > From Web-Database).
Return to top
The Wind Atlas for South Africa data is compatible with the WAsP,
WindFarmer, windPRO and WindFarm software; other software might
be compatible too. WAsP 11 can be downloaded and installed from the
WAsP web site (see links below) and used as a simple (and free) file
and project 'viewer/reader'.
WAsP 12 can be used to view data and results from the Observational Wind Atlas
as well as the LIB files from the Numerical Wind Atlas (in demo mode),
and also to make wind farm calculations and wind resource maps (licenced mode).
Temporary WAsP licences can be made available for participants during workshops.
The WAsP Suite Installer can be downloaded from the WAsP web site at https://www.wasp.dk/Download/WAsP12-Suite-Installer
The WAsP Map Editor, Climate Analyst and Turbine Editor can be downloaded,
installed and used free of charge.
Return to top
CSIR - Copyright 2010 © All Rights Reserved - Updated: June 2010
Webmaster