| METADATA | |
| Data set name | Interim High-Resolution Wind Resource Map for South Africa |
| Data set date | October 2017 |
| Data provider | DTU Wind Energy and CSIR |
| Contact persons | Niels G. Mortensen (DTU) or Eug?ne Mabille (CSIR) |
| Contact details | nimo@dtu.dk (DTU) or EMabille@csir.co.za (CSIR) |
| Data type |
Raster data sets with a grid cell size of 250 m |
| Data format | ArcGIS ASC |
| File name(s) | ZA_<province>_<resolution>_<parameter>_<version ID>.asc |
| Data origin | Microscale modelling in each grid point; no interpolation |
| DATA PARAMETERS | |
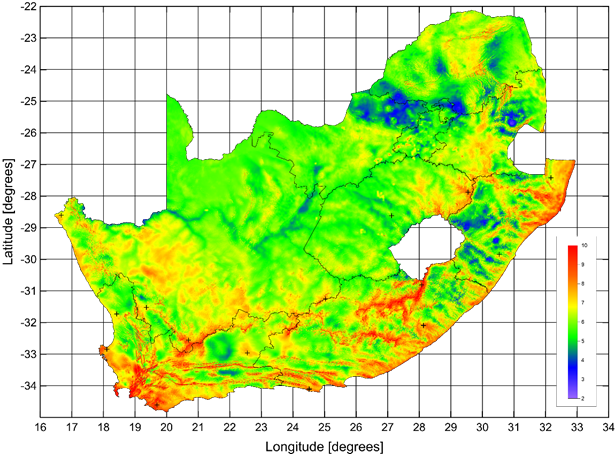
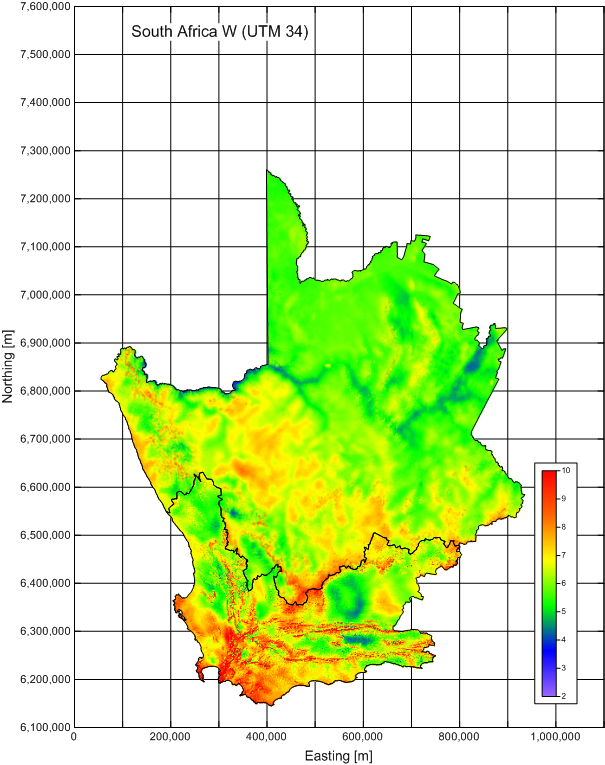
| Mean wind speed | Annual mean wind speed U [ms-1] @ 50, 100 and 200 m a.g.l |
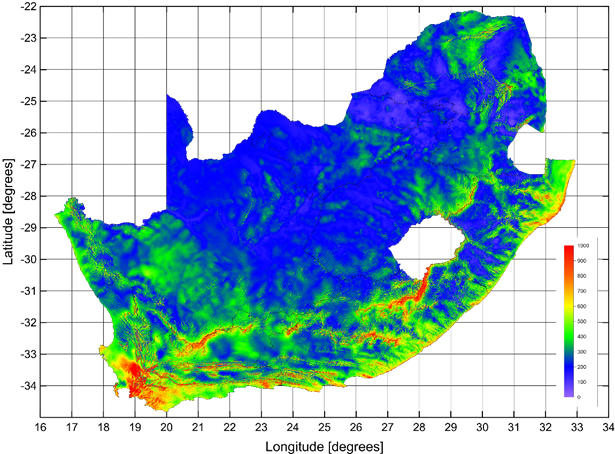
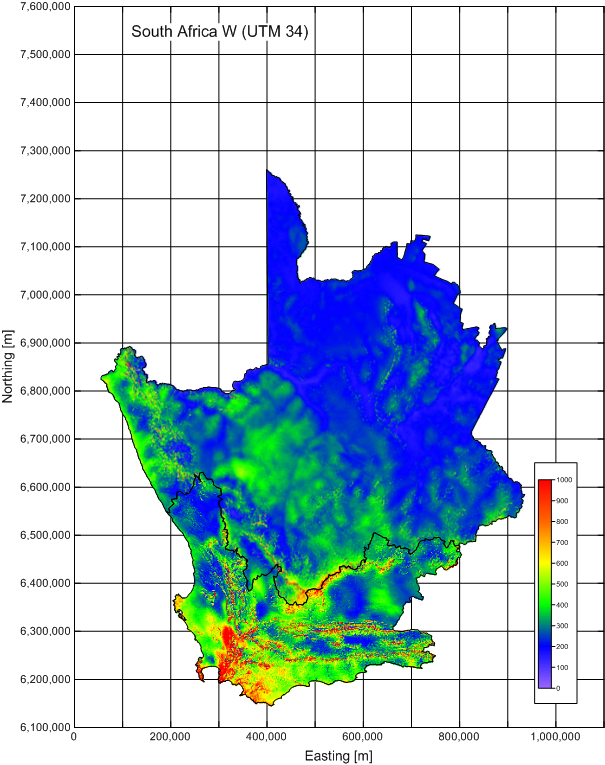
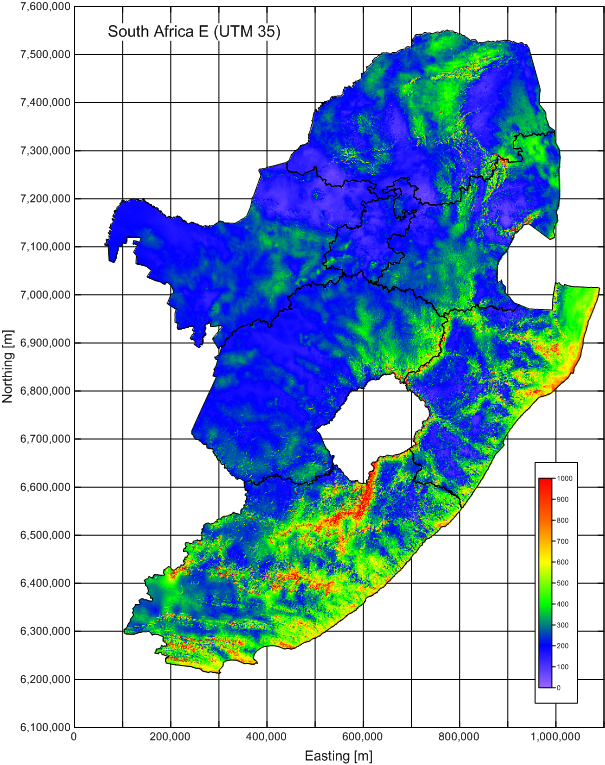
| Mean power density | Annual mean power density P [Wm-2] @ 50, 100 and 200 m a.g.l |
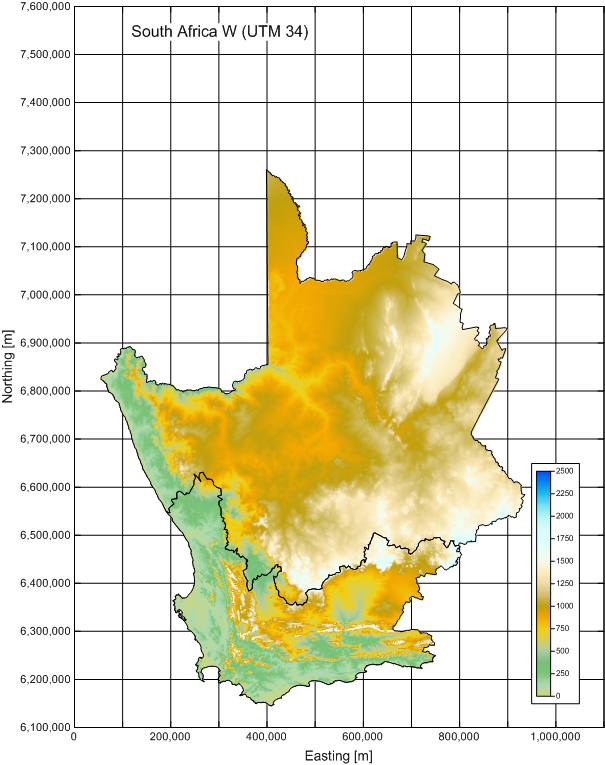
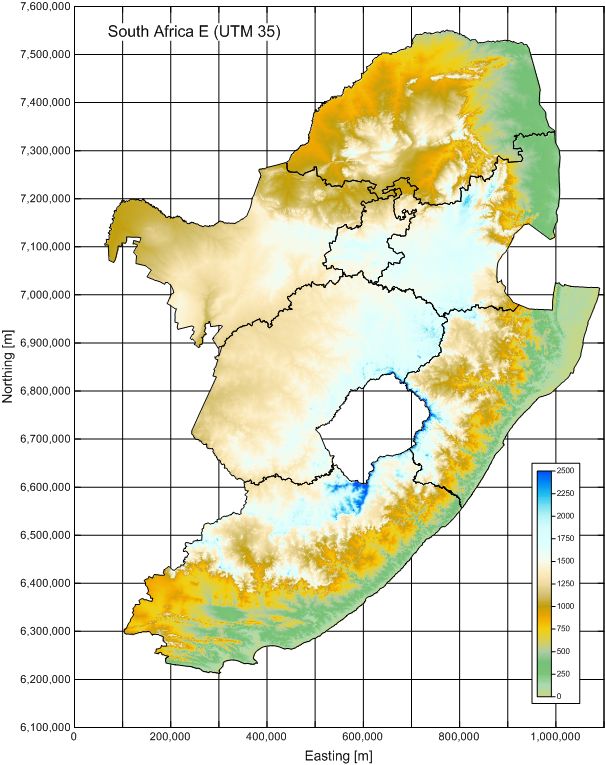
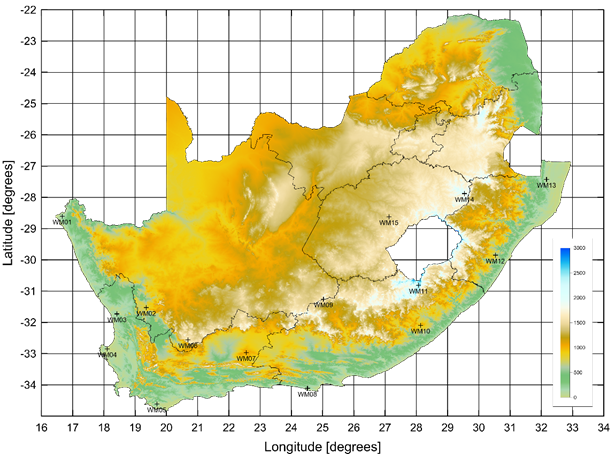
| Terrain elevation | Elevation of modelling site in [m] above mean sea level |
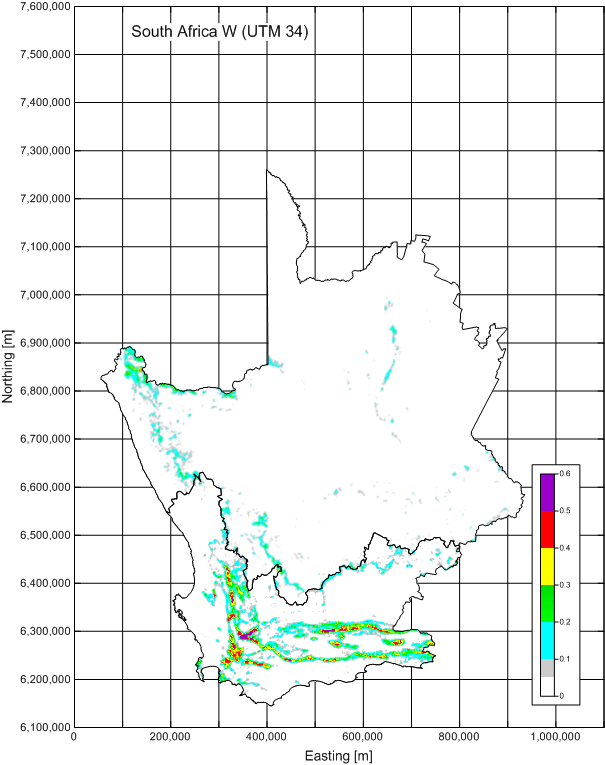
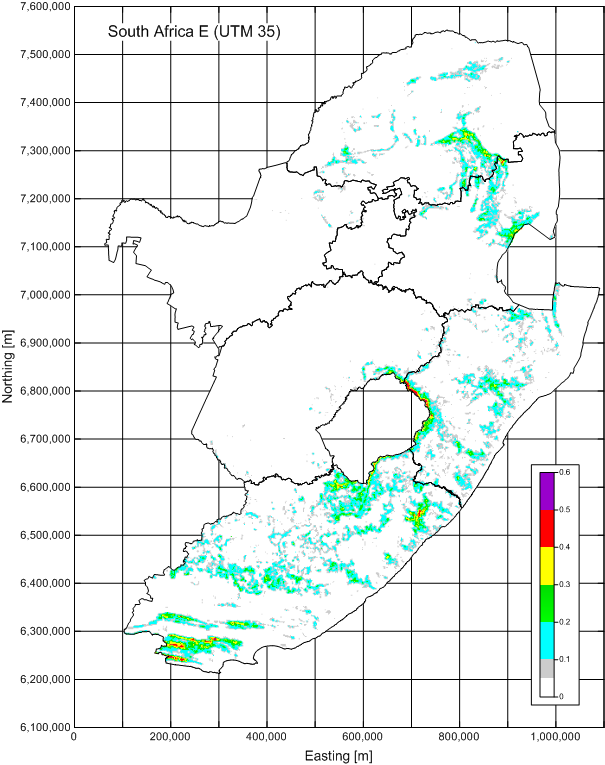
| Ruggedness index RIX |
Site RIX value calculated by WAsP (standard parameter setup) |
| COORDINATE SYSTEM |
|
| Projection | Universal Transverse Mercator (UTM) |
| Zone number | 34S (NC, WC) and 35S (EC, FS, GT, LP, MP, NL, NW) |
| Datum | World Geodetic System 1984 (WGS 84) |
| TECHNOLOGY | |
| Calculation software | WAsP Resource Mapping System with WAsP engine version 11 |
| Wind-climatological input | 5-km NWA (WRF-based, code name WASA2-MYN-NOAH-10D)* |
| Elevation data input | 100-m elevation grid derived from SRTM+ (NASA version 3) |
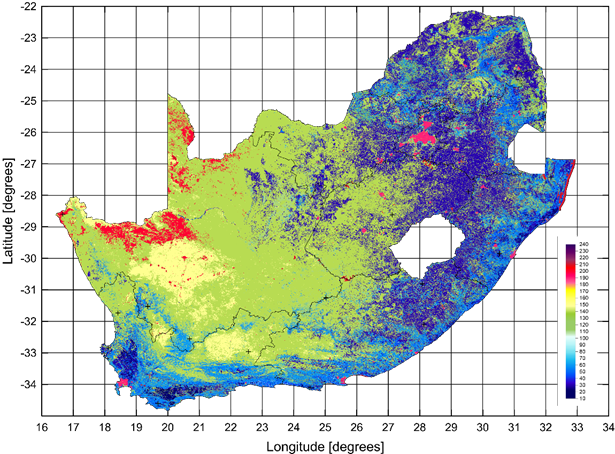
| Roughness data input | 300-m land cover grid derived from GlobCover 2009 (version 2.3) |
| Air density input | Standard atmosphere approximation w/ elevation variations only |
| NOTES |
| Purpose This data set was created for the Department of Environmental Affairs (DEA) of South Africa as a Fast-track High-resolution Wind Resource Map and Database covering all of South Africa. The wind resource maps were designed specifically for inclusion in GIS-based strategic environmental assessments (SEA) for the entire land mass of South Africa. The maps cover 9 provinces and an area of about 1,221,000 km2. Wind resource maps are preliminary and subject to change without notice if and when more accurate and reliable data, models and procedures become available. Methodology Reference is made to the information and documentation available from www.wasa.csir.co.za. A more detailed description of the data sets available are given at the end of this document. Validation is reported elsewhere. Limitations The data set is limited by the operational envelopes of the wind atlas methodology and the WAsP models. The accuracy depends on a) the accuracy of the VNWA (Validated Numerical Wind Atlas), which has been validated against the data from 10 WASA measurement masts, b) the WAsP microscale modelling and c) the input topographical data. In complex terrain (RIX > 5%), the wind resources may be significantly over-estimated by the WAsP microscale modelling. Above and close to built-up areas like cities, towns and villages, the results are less reliable. Close to and above forested areas, the results are also less reliable and should be interpreted and used accordingly. The data set was designed specifically for planning purposes and should be used with utmost care for design, development and detailed assessments of actual wind farms; where local, on-site measurements are strongly recommended. Available documentation The wind atlas methodology is described in the European Wind Atlas (1989); the application of WAsP in the software documentation, see www.wasp.dk. The Validated Numerical Wind Atlas (VNWA) for South Africa is a product of the Wind Atlas for South Africa project (WASA) and is described on the WASA download pages. (wasadata2.csir.co.za). Acknowledgements WASA team for provision of wind-climatological and topographical data. WAsP development teams at DTU Wind Energy and World in a Box Oy for Frogfoot development and application. SRTM Plus data were downloaded from NASA's Land Processes Distributed Active Archive Center (LP DAAC) located at the USGS Earth Resources Observation and Science (EROS) Center. GlobCover data are ? ESA 2010 and UCLouvain, see the ESA DUE GlobCover website. Province boundaries by Municipal Demarcation Board (MDB). |
| DISCLAIMER |
| In no event will the Technical
University of Denmark (DTU) or any person acting on behalf of DTU be
liable for any damage, including any lost profits, lost savings, or
other incidental or consequential damages arising out of the use or
inability to use the information and data provided in this data set,
even if DTU has been ad-vised of the possibility of such damage, or
for any claim by any other party. The principles, rules, exclusions and limitations provided in the Disclaimer on the WASA download site apply to the data set described here as well, even though this data set may not be distributed via the web site. By using this data set, you agree that the exclusions and limitations of liability set out in this disclaimer are reasonable. If you do not think they are reasonable, you must not use this data set. |
| *Wind climatologies for Limpopo north of 24 degrees south are given at a resolution of 15 km. |
The data sets are organised according to each of the nine provinces of South Africa.
| ISO | Province | Capital | Area | Fraction | UTM |
| EC | Eastern Cape | Bhisho (Bisho) | 168,966 km2 | 14% | 35 |
| FS | Free State | Bloemfontein | 129,825 km2 | 11% | 35 |
| GT | Gauteng | Johannesburg | 18,178 km2 | 1% | 35 |
| LP | Limpopo | Polokwane (Pietersburg) | 125,754 km2 | 10% | 35 |
| MP | Mpumalanga | Nelspruit | 76,495 km2 | 6% | 35 |
| NC | Northern Cape | Kimberley | 372,889 km2 | 31% | 34 |
| NL | KwaZulu-Natal | Pietermaritzburg | 94,361 km2 | 8% | 35 |
| NW | North West | Mahikeng (Mafikeng) | 104,882 km2 | 9% | 35 |
| WC | Western Cape | Cape Town | 129,462 km2 | 11% | 34 |
| ZA | Republic of South Africa | Pretoria, Cape Town, Bloemfontein | 1,220,813 km2 | 100% |
For each province, the following information is provided in metric ArcGIS ASC format grid files:
Wind information given for 50, 100 and 200 m above ground level and all data sets are given at 250 m horizontal resolution. The ASC files are distributed in ZIP archives.
For each province, the following information is provided in ASCII TXT format files:
Climate information at each of the 250-m modelling grid points will make it possible to calculate, say, specific mean power density from 0-25 ms-1, energy yield for any given wind turbine, capacity factor for any given wind turbine, etc. Wind climate and energy information is given for 50, 100 and 200 m above ground level. Data are stored in ASCII text files with the following format:
where x is UTM Easting [m], y is UTM Northing [m], z is height above ground level [m], SectorIndex is a sector index from 1 to 12 clockwise starting from north, A is Weibull scale parameter [ms-1], k is the Weibull scale parameter, and f is sector frequency. The TXT files are distributed in ZIP archives.
For South Africa, the following information is provided in geographical ArcGIS ASC format grid files: